Bitcoin’s [BTC] current rally is starting to resemble patterns seen during previous bull runs.
Why does this matter? On the weekly chart, BTC’s 7%+ rally has pushed the price back into the $85k-$90k range seen earlier this year. More significantly, the short-term holders (people who have had a stake in BTC for less than 150 days) are now back around their breakeven levels, implying that recent BTC buyers are recovering their unrealized losses as BTC moves higher.
Against this backdrop, a fresh wave of euphoria could trigger a local top for Bitcoin. Remarkably, the latest reading of the Fear and Greed index suggests that BTC entered ‘extreme greed’ on the 22nd of September for the first time since the Q3 2025 cycle. This puts market sentiment at a more stretched level than when BTC hit $126k in late September-early October 2025.
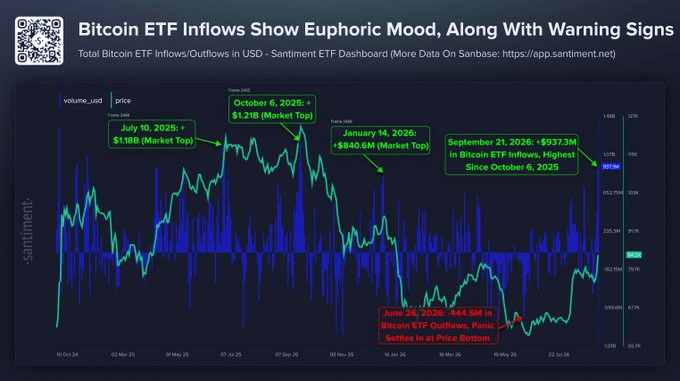
Interestingly, a recent Santiment report shows similar signs of euphoria on-chain.
As the chart above shows, Bitcoin ETFs’ demand has surged substantially, with $937.3 million in net inflows on the 21st of September. It marked the largest single-day inflow since BTC’s October 2025 peak, setting another record for the year. As Bitcoin trades near eight-month highs, it appears that ETF investors are chasing the rally again, adding another layer of heat to the market.
In essence, short-term holders are back at breakeven, the Fear and Greed Index is in extreme greed, and ETF demand is surging. While this supports the bullish trend, it also raises the risk of BTC struggling to break $90k in one straight move as the market heats up.
Notably, this is where historical setups become relevant.
Bitcoin’s leverage setup meets the MVRV signal
Bitcoin’s euphoria is not limited to ETF spot demand.
Instead, it is also spilling into derivatives. According to CoinGlass, Bitcoin’s 24h liquidation heatmap highlights a large pool of long liquidity just above the current trading range, which could be considered an accumulation of leverage as BTC approaches higher levels. The said scenario can result in a bull-trap should BTC fail to break above $90k.
This is where historical setups come into play. In both 2019 and 2023 cases, Bitcoin’s MVRV (Market Value over Realized Value) crossed back above its 365-day average following negative momentum. This suggested that the market was entering a healthier profit zone with investor profitability and momentum starting to improve.
Both instances saw BTC entering a stronger recovery phase. Most notably, the current crossover appears to be exhibiting similar traits.
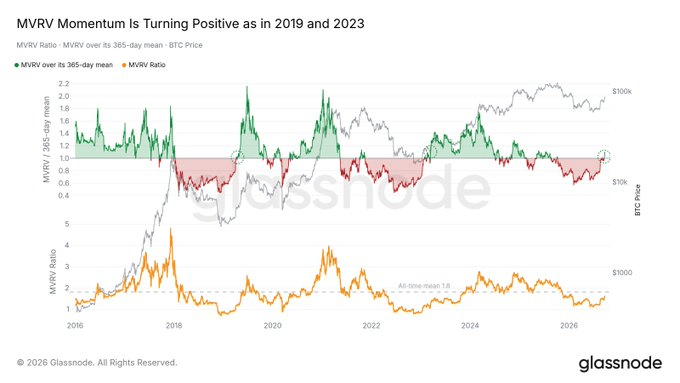
In this regard, the recent reversal of short-term holders to the breakeven point can be seen as a positive development. As BTC moves above the average cost of recent buyers, selling pressure from underwater holders is expected to ease, paving the way for the market to move higher.
This could keep FOMO among ETF investors high. In turn, Bitcoin’s overheated signs are expected to trigger a short squeeze, thus trapping late shorts to propel the rally further. If this trend continues, it could pave the way for Bitcoin’s $90k breakout.