Disclaimer: The information presented does not constitute financial, investment, trading, or other types of advice and is solely the writer’s opinion.
- Dogecoin was bearish in the near-term but bullish on higher timeframes.
- DOGE traders can go for scalp short trades if the price falls below the near-term support, targeting $0.07.
Dogecoin [DOGE] rallied 8% last week, going from the 7 August low at $0.0717 to $0.07745 on 12 August. Since then, it has retraced most of its gains. The momentum of the meme coin signaled further downside was possible.
Realistic or not, here’s DOGE’s market cap in BTC’s terms
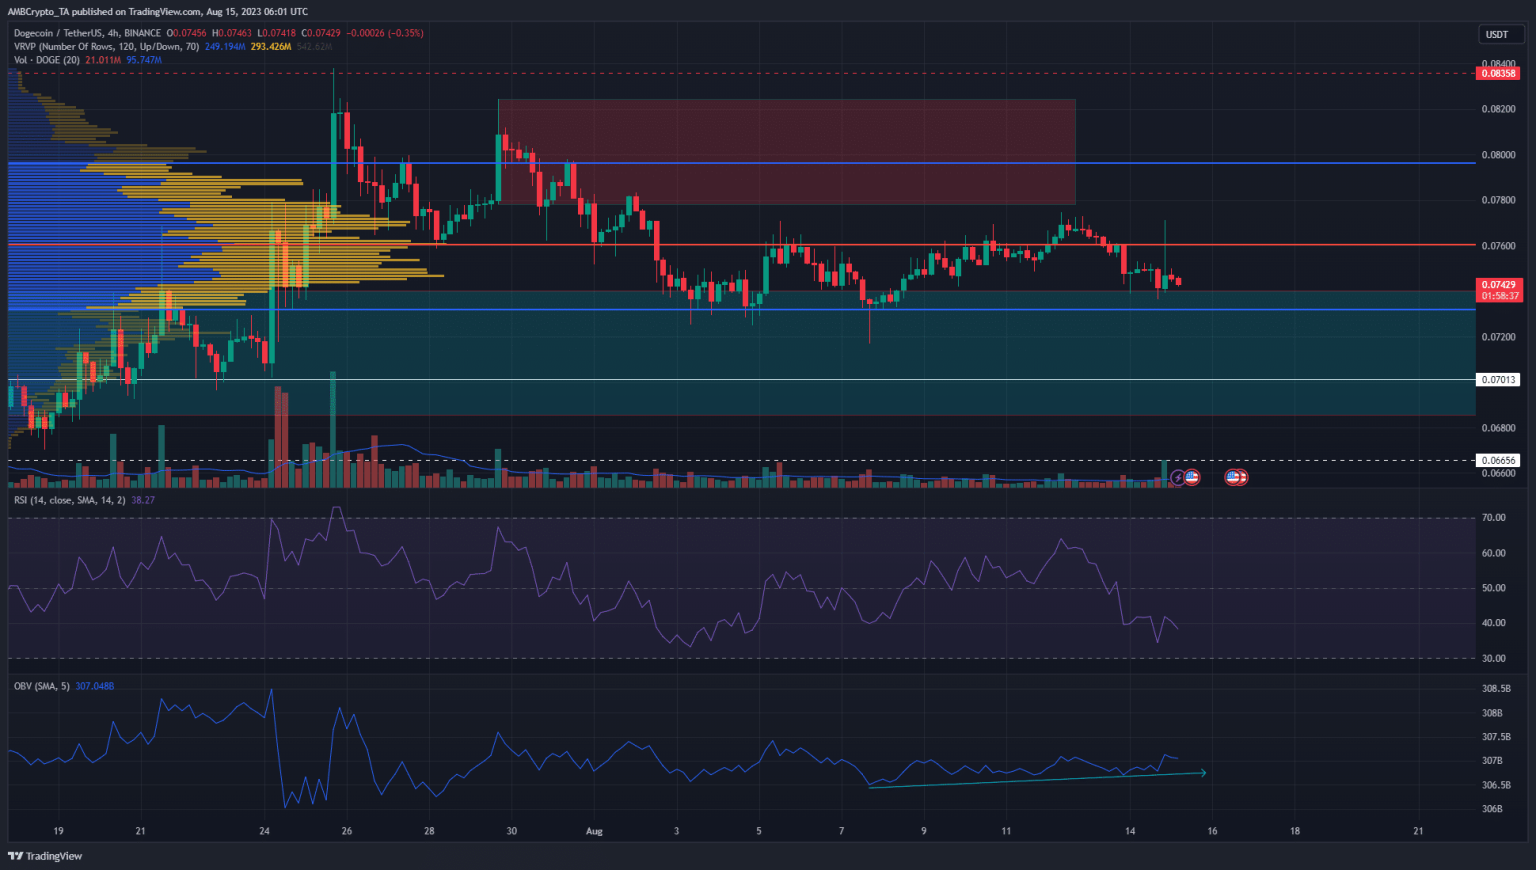
Dogecoin was in the grip of bearish sentiment, but it was trading just above a higher timeframe area of interest. Therefore, while a reversal was likely, another drop toward $0.07 can be expected.
Dogecoin had some demand, but a 5% drop was still likely
![Dogecoin [DOGE]](https://statics.ambcrypto.com/wp-content/uploads/2023/08/PP-1-DOGE-price-1.png)
Source: DOGE/USDT on TradingView
The RSI showed bearish momentum as DOGE neared the support level at $0.07325. The Volume Profile Visible Range tool also highlighted this level as the Value Area Low. The Value Area High and Point of Control were at $0.0797 and $0.076 respectively.
These overhead levels represented strong resistance. The market structure of DOGE was bearish once more after it slipped below the $0.075 mark on 14 August. Yet, in the past week, the OBV has slowly climbed higher. This showed buying pressure was stronger despite the recent losses.
The cyan box that extended from $0.068-$0.074 represented a bullish breaker block on the 3-day chart. On that higher timeframe chart, the market structure and momentum were bullish. Therefore, a drop toward $0.069-$0.072 could see an influx of Dogecoin buyers.
In that scenario, bulls can wait for a lower timeframe market structure break to find buying opportunities.
The futures market showed bearish sentiment remained dominant
![Dogecoin [DOGE]](https://statics.ambcrypto.com/wp-content/uploads/2023/08/PP-1-DOGE-coinalyze-1.png)
Source: Coinalyze
In the past three days, both the price and the Open Interest have slowly slid lower. This indicated bearish sentiment prevailed in the futures market. Moreover, the spot CVD was also in a downtrend.
The inference was that DOGE sellers were dominant, which opposed the findings from the OBV.
Is your portfolio green? Check the Dogecoin Profit Calculator
The price action chart on the H4 timeframe showed that $0.073 was an important short-term support. If DOGE was unable to hold on, it would likely fall to $0.07, a 4% drop.
The OBV showed accumulation but the spot CVD showed selling pressure, with the latter being the more compelling piece of evidence.

