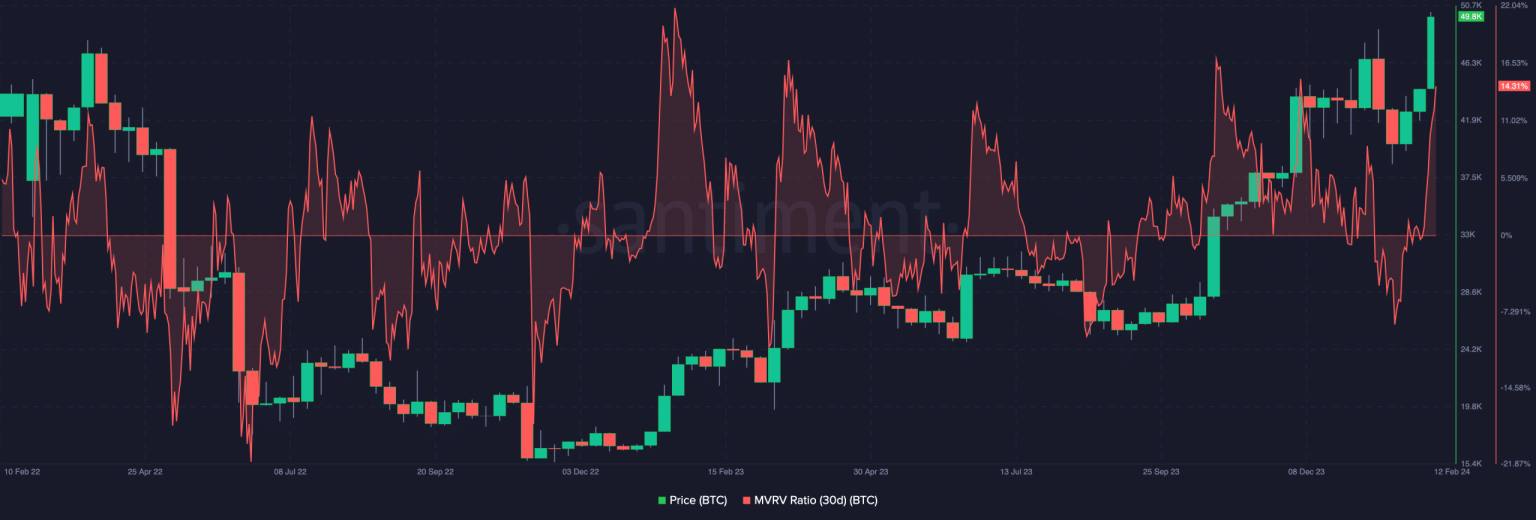
- The 30-day MVRV ratio suggests a looming correction for BTC.
- Open Interest climbed to its highest in over two years as Bitcoin eyed $52,000.
If you are planning on buying Bitcoin [BTC] for quick gains because the price hit $50,000, then you might have to give it another thought. Well, one can argue that the sentiment around the market was bullish. But history, as AMBCrypto confirmed, revealed that we might not yet be in an “up only” situation for the coin.
Before we arrived at this conclusion, we analyzed Bitcoin’s Market Value to Realized Value (MVRV) ratio. We also evaluated how it relates to the price action. When the MVRV ratio is high, it suggests that the market value of Bitcoin has surpassed the average value at which coins last moved.
Hold on! The coast is not yet clear
If this is the case, BTC could be considered overvalued. On the other hand, a low MVRV ratio suggests that the coin is undervalued. At press time, AMBCrypto’s analysis of Santiment showed that the 30-day MVRV ratio was 14.31%.
Historically, whenever the metric rises as high as this, BTC corrects afterward. Therefore, this increase could be a warning signal that the coin price might drop significantly over the coming days.
As of this writing, Bitcoin’s price was $50,105. This value represents a 17.83% increase in the last seven days.
With the price recovery, one can assume that the liquidity flush post-ETF approval could be over. Despite the price prediction, investor interest in Bitcoin has been soaring. Evidence of this could be found in the Open Interest (OI). The OI is the total amount of open futures contracts.
At press time, Glassnode’s data showed that Bitcoin’s OI was over $19 billion. This represents the highest value seen for over two years.
Buy now, wail later, or wait now, buy later
The OI increase suggests that buyers were more aggressive in the market while sellers have taken a backseat. Should the OI continue to increase alongside the price action, BTC might head toward $52,000. But if the aggression subsides, Bitcoin’s price might dump into the key support just before it begins another rally.
From a trading perspective, the Exponential Moving Average (EMA) showed a bullish bias for BTC.
As of this writing, the 20 EMA (blue) had crossed over the 50 EMA (yellow). Likewise, the 50 EMA had crossed over the 200 EMA (cyan). Crossovers like these suggest that Bitcoin might stay bullish whether in the short term or not.
BTC had also broken above all three EMAs, indicating that a strong resistance was not yet ahead. However, the Relative Strength Index (RSI) indicated that the coin was overbought since the reading crossed 70.00.
The Money Flow Index (MFI) also rose past 80.00, suggesting the same condition as the RSI.
Read Bitcoin’s [BTC] Price Prediction 2024-2025
While this infers intense buying pressure, it could also lead to a pullback for the coin. Should BTC retrace, the price might fall to the $46,000 to $48,000 region. In the long term, this might serve as another buying opportunity.
But market players who want short-term gains might need to wait for more correction as profit-taking can appear at any point in time.


