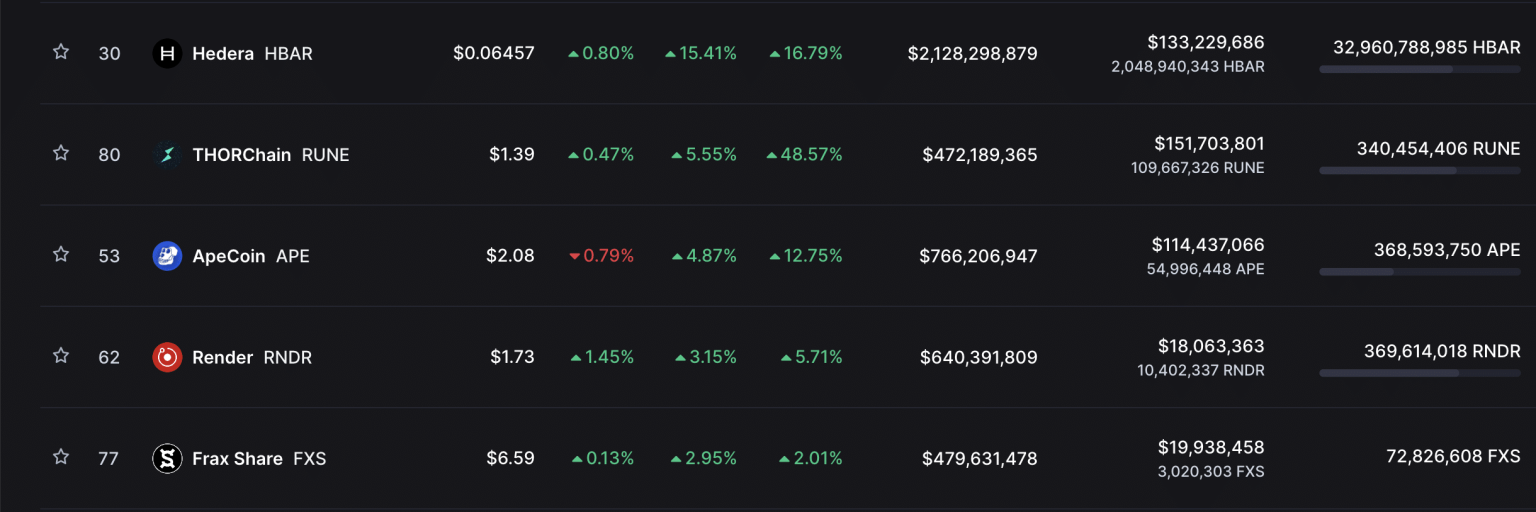
- HBAR’s value has surged due to increased accumulation.
- Price, however, remains significantly volatile and might see a correction.
Hedera [HBAR] jumped by 16% in the last week amid the launch of its first social network Calaxy. According to cryptocurrency price tracker CoinMarketCap, the altcoin’s price rallied by 15% in the last 24 hours, making it the highest gainer during that period.

Source: CoinMarketCap
Is your portfolio green? Check out the Hedera Profit Calculator
HBAR is not slowing down
At press time, HBAR exchanged hands at $0.06438 per token. The double-digit price rally in the last week was due to the commencement of a new bull cycle, which forced new liquidity into the HBAR market.
On a D1 chart, HBAR’s Moving Average Convergence Divergence (MACD) revealed the momentum shift from the sell side to the buy side on 5 August. This was when the MACD line crossed above the signal line, with the indicator marked by only green histogram bars since then. Within those nine days, HBAR’s value went up by 32%.
The re-entry of the bulls also caused the token’s Chaikin Money Flow (CMF) to ascend into positive territory. This indicator tracks the flow of money into and out of an asset over a period of time. A positive CMF value suggests that more money flows into an asset than out of it. Facing north at the time of writing, the HBAR market remained flooded with liquidity.
The price growth caused HBAR accumulation to increase in the last week. Momentum indicators inched close to overbought positions at the time of writing. Its Relative Strength Index (RSI) was 68.58, while the Money Flow Index (MFI) rested at 74.65.

Source: HBAR/USDT on TradingView
Realistic or not, here’s Hedera market cap in BTC’s terms
HBAR excels in the futures market
A look at how HBAR traded in the futures market revealed a surge in Open Interest in the last week. This refers to the number of opened trading positions and can be used to gauge the sentiment of traders.
According to Coinglass, HBAR’s Open Interest increased by 100% since 6 August. When an asset’s Open Interest grows in this manner, it indicates a lot of interest in the market.

Source: Coinglass
A further look at the token’s Funding Rates showed that most traders were holding positions betting on a price increase. At press time, this was a positive 0.0099%.

Source: Coinglass
Although many continue to bet in favor of a price rally, HBAR’s Bollinger Bands suggested that its price remained significantly volatile. While HBAR traded above the upper band of the indicator, the wide gap between the upper and lower bands suggested volatility was high, and a correction might occur at any time.

Source: HBAR/USDT on TradingView

