Disclaimer: The information presented does not constitute financial, investment, trading, or other types of advice and is solely the writer’s opinion.
- The $20.4-$20.8 is an area of liquidity.
- The move downward to hunt stop-losses could see a reversal toward $22.3 and $23.9.
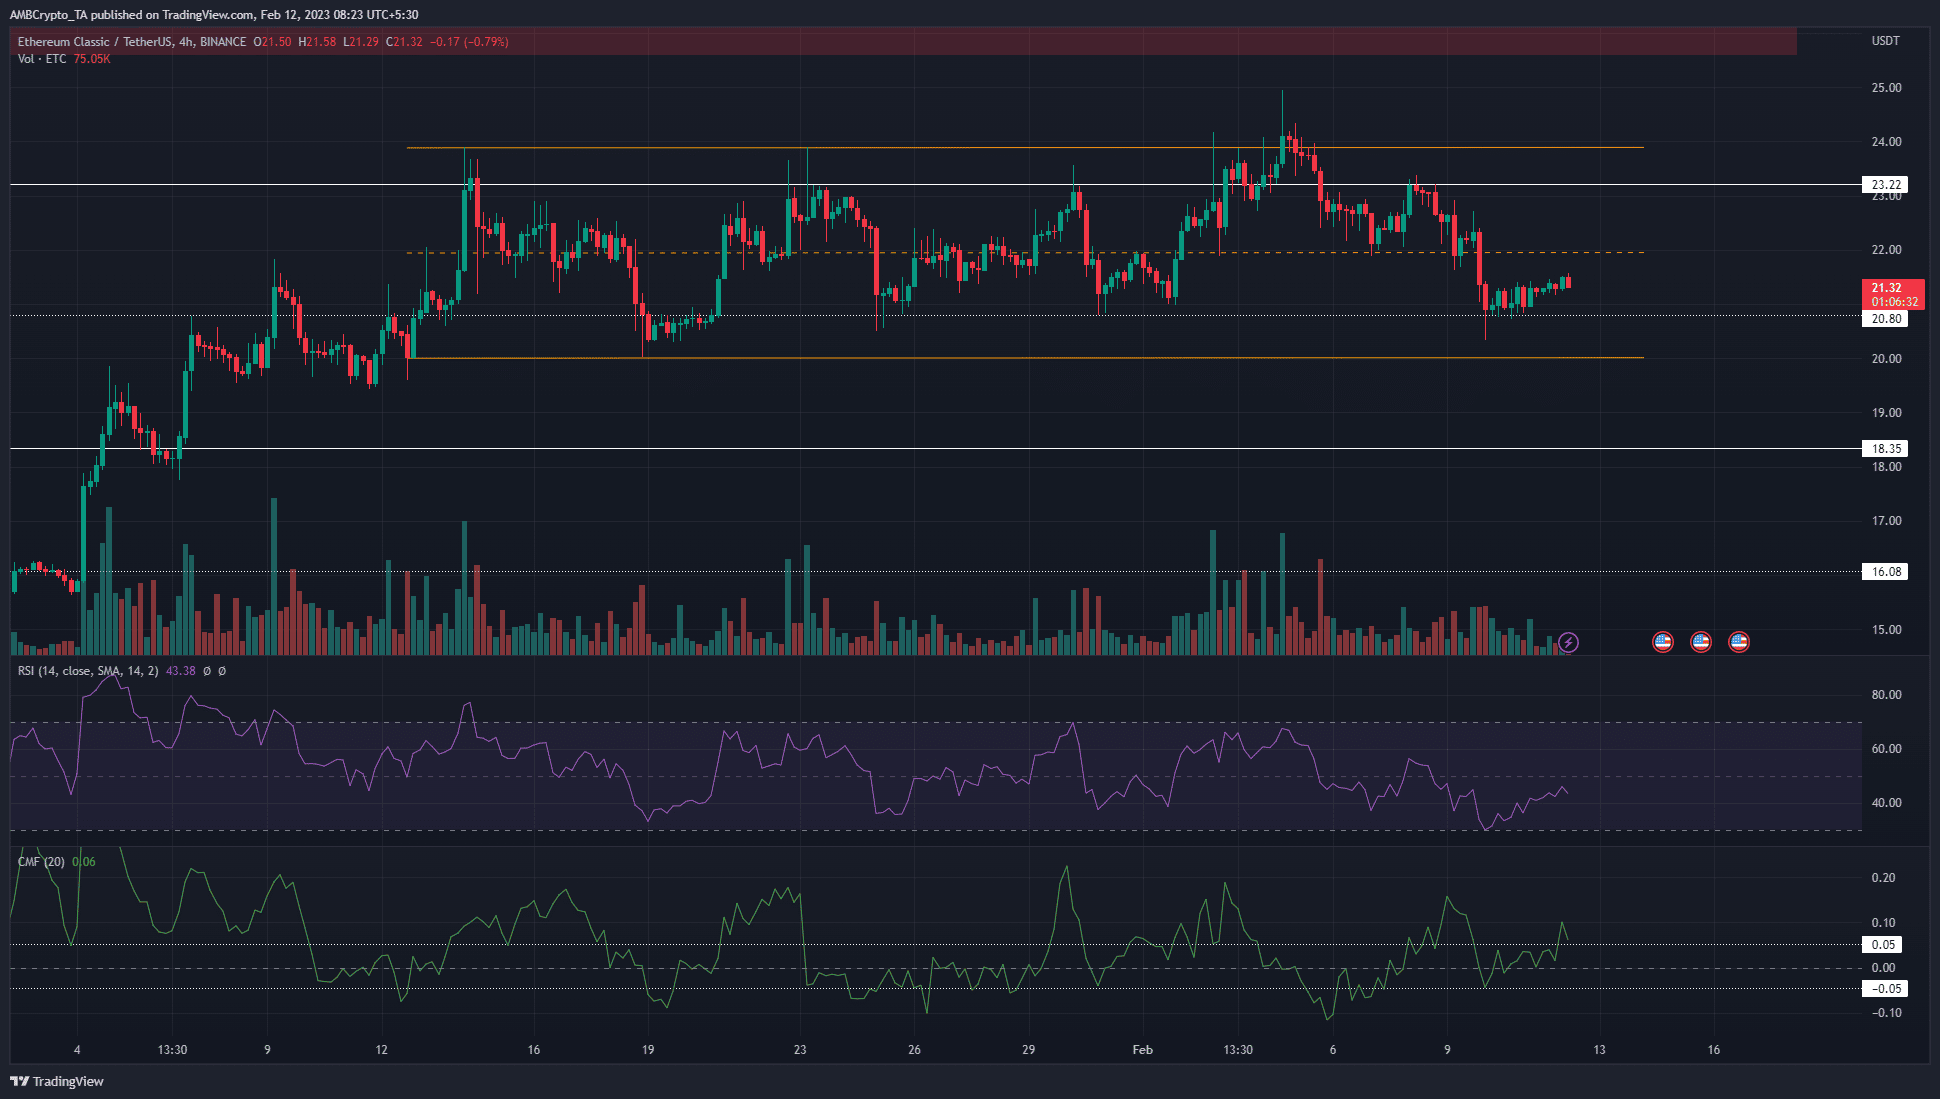
Ethereum Classic saw the lower timeframe momentum flip to bearish on 5 February, when the price fell below $23.22. ETC also retested the same as resistance on 8 February. Due to this drop, the market structure also shifted to a bearish bias.
Realistic or not, here’s ETC’s market cap in BTC’s terms
Bitcoin sat on a strong level of support at $21.6k. The recent drop filled the imbalance on BTC’s price chart. It appeared likely that upward momentum can continue once more after flushing out late but overeager bulls.
The range lows remain untested but bearish momentum has weakened

Source: ETC/USDT on TradingView
The $20.8 level has been important since early January. Ethereum Classic has traded within the range (orange) since 14 January. The range extended from $20 to $23.9, with the mid-point at $21.95. The mid-point has been a short-term significant level of support and resistance over the past month.
How much are 1, 10, 100 ETC worth?
The market structure of ETC on the 12-hour chart was decisively flipped to bearish when the bulls were exhausted by the selling pressure on 9 February. Prices slumped sharply beneath the mid-range mark. Since then, a bounce in prices was seen.
The RSI climbed back toward neutral 50, which showed the bearish momentum was losing strength. The CMF also pulled itself above +0.05, which denoted significant capital flow into the market over the past couple of days.
A move back above the mid-range mark and a subsequent retest can be a buying opportunity. Alternatively, a move to the range lows at $20, which is also a psychological support level, could see a bounce toward the range highs.
Long liquidations fueled a move lower and sentiment retains a bearish bias

Source: Coinalyze
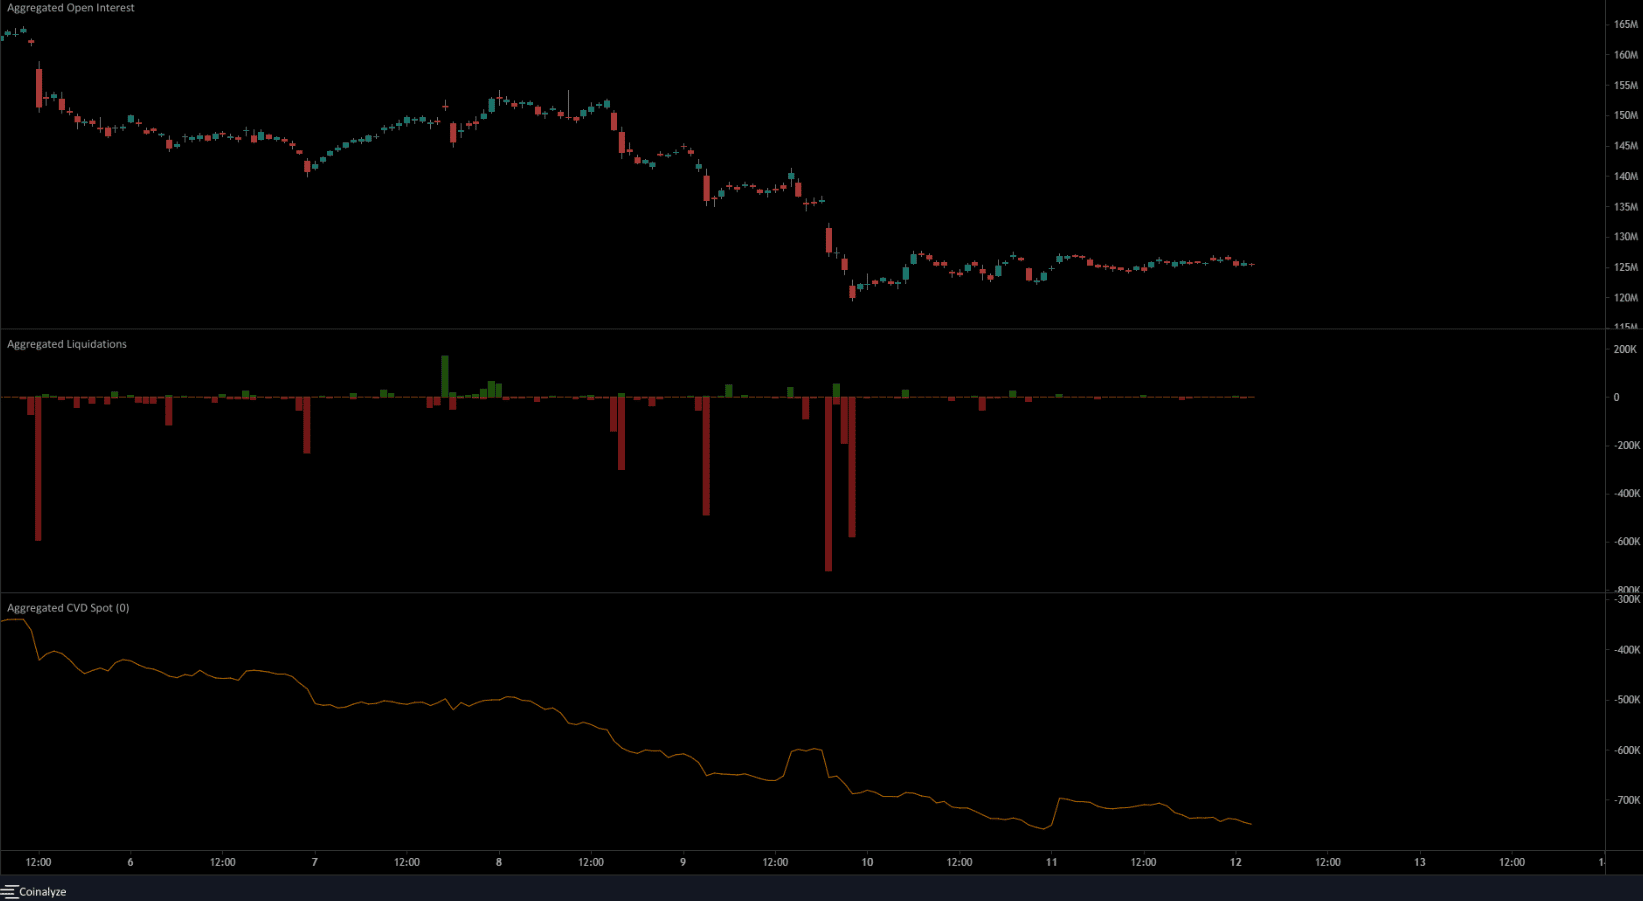
9 February saw $1.5 million worth of long positions liquidated in the span of four hours. This was when the price slipped from $22 to reach the $20.4 mark. The sudden drop alongside the liquidations meant that selling pressure also spiked temporarily, but halted just above $20.
In the past couple of days, the falling spot CVD has flattened. This suggested the selling pressure could be at an end, at least temporarily.
However, the Open Interest posed worrying questions to the bulls. It has been flat over the past couple of hours, even as the price bounced 4.8% from $20.34 to $21.32. This happened over the weekend.
Hence, the conclusion was not a short-term consolidation phase to reverse the selling pressure. Rather it could be some calm before another leg down on the price charts.


