- Assessing Bitcoin’s RSI strategy for identifying sell and buy zones.
- Why it is better to consider multiple other metrics before executing Bitcoin trades.
Over the last few months, it has become abundantly clear that Bitcoin [BTC] traders have been focused on short-term profits. As a result, prices have been locked in a relatively narrow range compared to their highly volatile nature in the past.
Is your portfolio green? Check out the Bitcoin Profit Calculator
Every market condition offers some opportunity, as has been the case with Bitcoin’s narrow range. As always, those who know when to buy and when to sell benefit the most. Interestingly, identifying buy and sell zones in the last few weeks may have been easier than you might think.
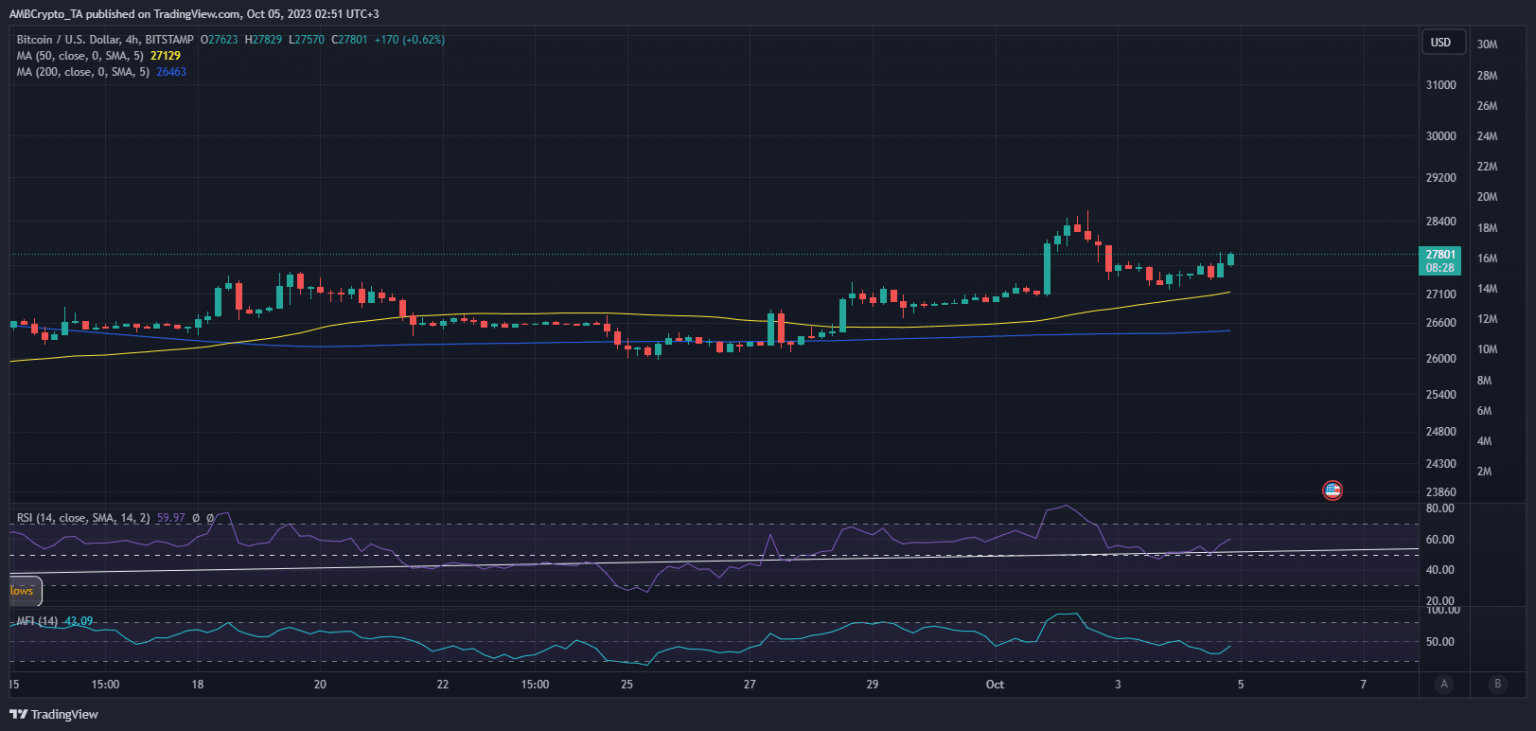
X-based crypto analyst Ali recently noted that the Relative Strength Index (RSI) has been quite a reliable indicator for identifying market tops and bottoms during the. According to his analysis, buying pressure has been manifesting mostly when the RSI drops below the 30.35 level.
On the other hand, sell pressure tends to manifest above the 74.21 RSI level. Note that these observations have been taking place in the four-hour time frame.
#Bitcoin | Over the past month, the 4-hour chart RSI has proven a reliable indicator of local tops and bottoms!
The strategy is simple:
???? Sell $BTC when RSI exceeds 74.21.
???? Buy #BTC when RSI dips below 30.35.Currently, the RSI stands at 51. Patience is key! We might be… pic.twitter.com/5KEL7NBmQg
— Ali (@ali_charts) October 4, 2023
Does the Bitcoin RSI analysis hold water?
We decided to put the idea to the test and found that it worked for the most part. However, there were instances when the market crashed or rallied beyond the RSI levels where price pivots were expected. A good example of such an incident was the rally that occurred after mid-June and the crash that happened in August.
The two instances noted above underscore two instances where prices continued in their trend despite going past the RSI pivot levels. BTC’s hovered at 59.80 at the time of writing, and the same indicator is currently oriented towards the upside.
This was also in line with Bitcoin’s current price action which appeared to be returning to a bullish inclination in the last few hours according to the four-hour chart.

Source: TradingView
Perhaps one takeaway here was that there were other key observations to consider before executing a position. Especially if it is of the leveraged kind. It helps to gather more data. For example, metrics may indicate when sell pressure or bullish momentum continues to intensify.
Read Bitcoin’s [BTC] price prediction 2023-24
As far as Bitcoin’s current situation was concerned, recent data revealed that the cryptocurrency was still experiencing healthy demand. Bitcoin whales holding over 100 coins are still buying and have just reached a new monthly high.
???? #Bitcoin $BTC Number of Addresses Holding 100+ Coins just reached a 1-month high of 16,017
Previous 1-month high of 16,016 was observed on 03 October 2023
View metric:https://t.co/ceqO9LHIvs pic.twitter.com/kKN6s1BXqu
— glassnode alerts (@glassnodealerts) October 4, 2023
But is this demand enough to support BTC’s struggle to reclaim the $30,000 price level this month? Exchange data revealed that BTC flows have kicked off October by declining likely due to uncertainty.
Nevertheless, exchange outflows remain higher than inflows, hence the net positive overall demand.

Source: Glassnode

