- A recent analysis revealed the possibility of BTC’s price touching $32,000.
- However, on-chain metrics suggested that BTC’s chart can head in any direction.
Bitcoin [BTC] continues to push its price upward and it even crossed the $27,000 mark recently. At press time, BTC was up 4.5% and was trading at $27,331.13 with a market capitalization of $528 billion.
Thanks to the uptrend, profit transactions have more than doubled compared to loss transactions on the BTC network since Wednesday.
???? With #Bitcoin jumping above $27k for the first time since June 12th, there are 2.4x as many profit transactions as loss transactions on the $BTC network since Wednesday. Markets are very polarized with #FOMO and drop fears both happening simultaneously. https://t.co/riPv1JYnfg pic.twitter.com/AsZ3485KDR
— Santiment (@santimentfeed) March 17, 2023
Read Bitcoin’s [BTC] Price Prediction 2023-24
Bitcoin can reach new highs
BTC enjoyed its bull rally, and a recent analysis posted on CryptoQuant revealed that the rally might continue. Ankaramurka, an author and analyst at CryptoQuant, mentioned that a look at Bitcoin using the Elliott Waves analysis technique suggested that Bitcoin still has a great potential to rise in price.
Not only that, but the price uptick might continue until BTC touches the resistance level in the price range of $29,200 – $32,300, which seems ambitious. Though the figure might seem high to many, interestingly, quite a few on-chain metrics supported the possibility of the uptick.
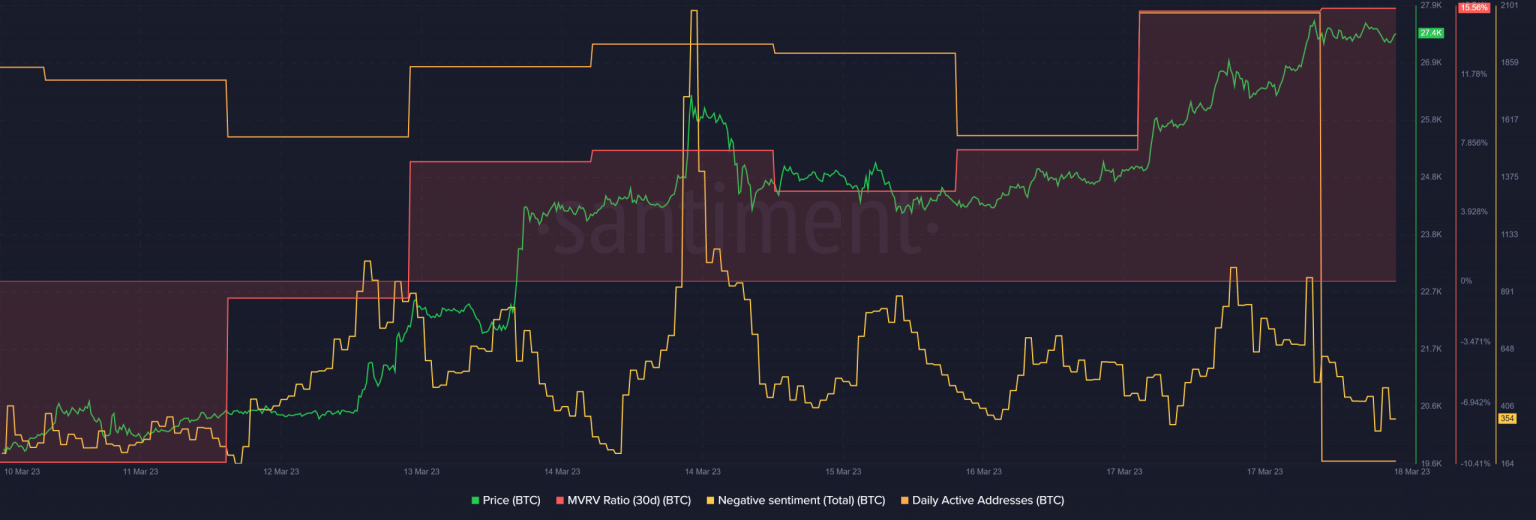
For instance, BTC’s MVRV Ratio was considerably up, which was a bullish signal. Negative sentiments around BTC also seemed to have declined. BTC’s daily active addresses have increased lately.

Source: Santiment
A greedy market?
It was interesting to note that Bitcoin’s Fear and Greed Index had a score of 64, at press time. This indicated a bullish momentum and suggested a further uptrend in the coming days.

Source: Alternative.me
Not only that, a crypto analyst by the name of Stockmoney Lizards on Twitter, pointed out similarities between BTC’s current and 2019 price action.
In 2019, BTC’s price registered a massive uptick of over 150% when its chart was similar to that of today’s. Therefore, the possibility of BTC touching a resistance level of around $32,000 seemed likely.
This bull run just got unstoppable pic.twitter.com/7O3tNPT1bx
— Stockmoney Lizards (@StockmoneyL) March 18, 2023
Is your portfolio green? Check the Bitcoin Profit Calculator
Here is the catch
While the aforementioned developments give rise to a strong bullish notion, things on the ground can be a little different. BQYoutube, an analyst and author at CryptoQuant, revealed in an analysis that BTC’s exchange inflow was increasing, which was a bearish sign.
As exchange inflow spiked, BTC’s supply on exchanges also increased. This indicated that there was an increase in selling pressure, which could result in a halt to the BTC bull rally.
Additionally, BTC’s Relative Strength Index (RSI) was in an overbought position, further increasing the chances of higher selling pressure in the coming days.

Source: CryptoQuant

