- Aptos recently concluded its NYC event in partnership with KYD Labs.
- The on-chain metrics supported the massive price hike but the indicators were bearish.
Aptos [APT] surprised the crypto industry over the last few days by registering massive price gains. According to CoinMarketCap, APT’s price increased by nearly 40% in the last seven days, and at the time of writing, it was trading at $17.63 with a market capitalization of more than $2.8 billion.
While APT continued to rise, Aptos recently organized an event in partnership with KYD Labs. As a part of the collaboration, Aptos and KYD Labs created the future of fan loyalty through live event ticketing.
Aptos ✊ @KYDLabs
Our NYC event was super charged! The meet up celebrated Aptos’ first step in changing the broken ticketing system.
When we put power back in the hands of creators, the community can focus on what matters–building culture & connection across Web3 and beyond! pic.twitter.com/v7PYoJ2Uot
— Aptos (@Aptos_Network) January 27, 2023
Realistic or not, here’s APT’s market cap in BTC’s terms
Moreover, there was even better news for the investors- LunarCrush’s data suggested that the pump might continue in the following days. In fact, Aptos was on the list of the cryptos with the highest Galaxy Score, which is a massive bullish indicator.
TOP 15 coins by @LunarCRUSH Galaxy Score
Galaxy Score – proprietary score that is constantly measuring crypto against itself with respect to the community metrics pulled in from across web$FLOKI $CULT $QUACK $YOOSHI $NAKA $KAI $KLV $DEGO $EWT $WAVES $LSS #C98 $APT $ASM $QUICK pic.twitter.com/ylEDgIavR1
— ???????? CryptoDiffer – StandWithUkraine ???????? (@CryptoDiffer) January 27, 2023
The good days are far from over
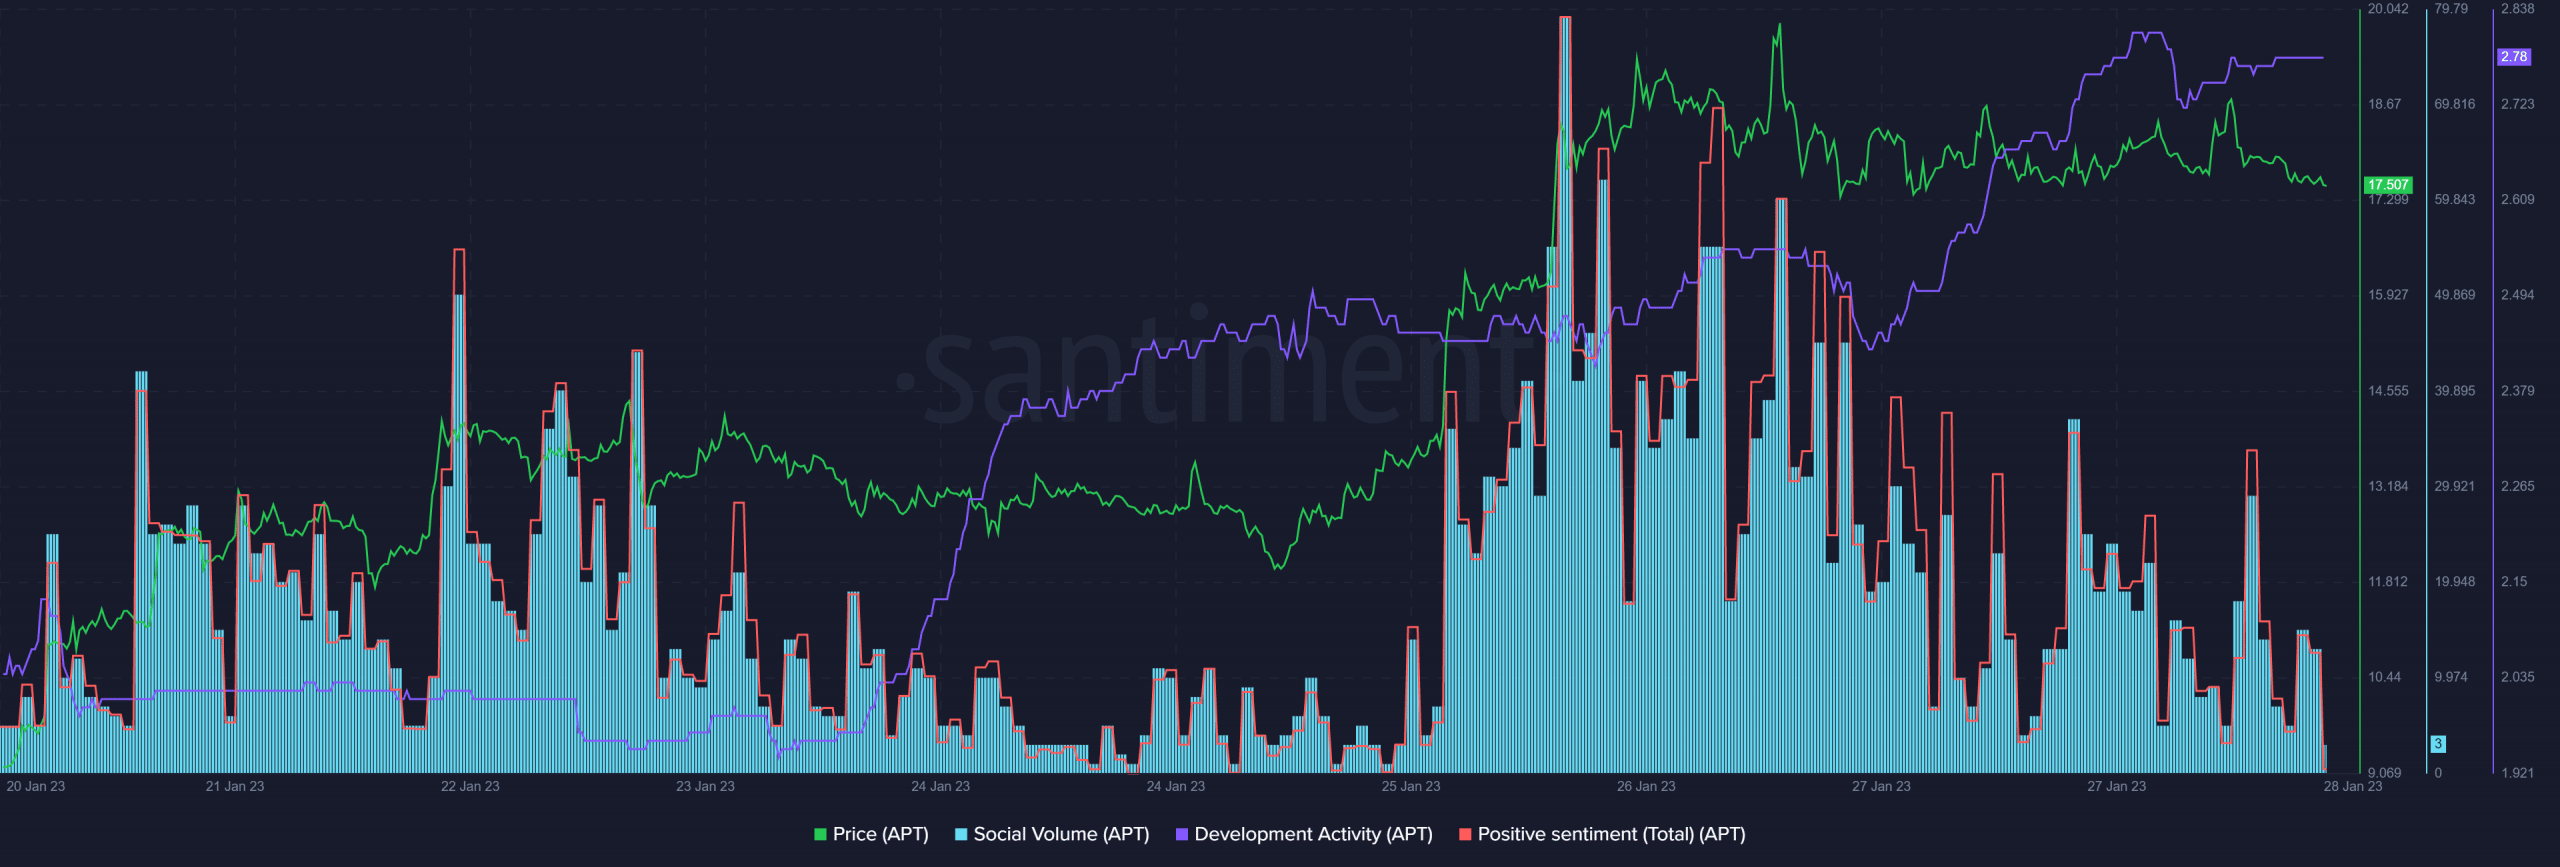
A look at APT’s on-chain metrics gave a bullish signal, as most of them were supportive of a continued surge. APT’s development activity increased in the last week, reflecting developers’ efforts to improve the network.
Positive sentiments around APT also increased, reflecting investors’ trust in the token. Moreover, APT’s popularity saw exponential growth as its social volume registered an uptick.

Source: Santiment
How much are 1,10,100 APTs worth today
But these can be troublesome
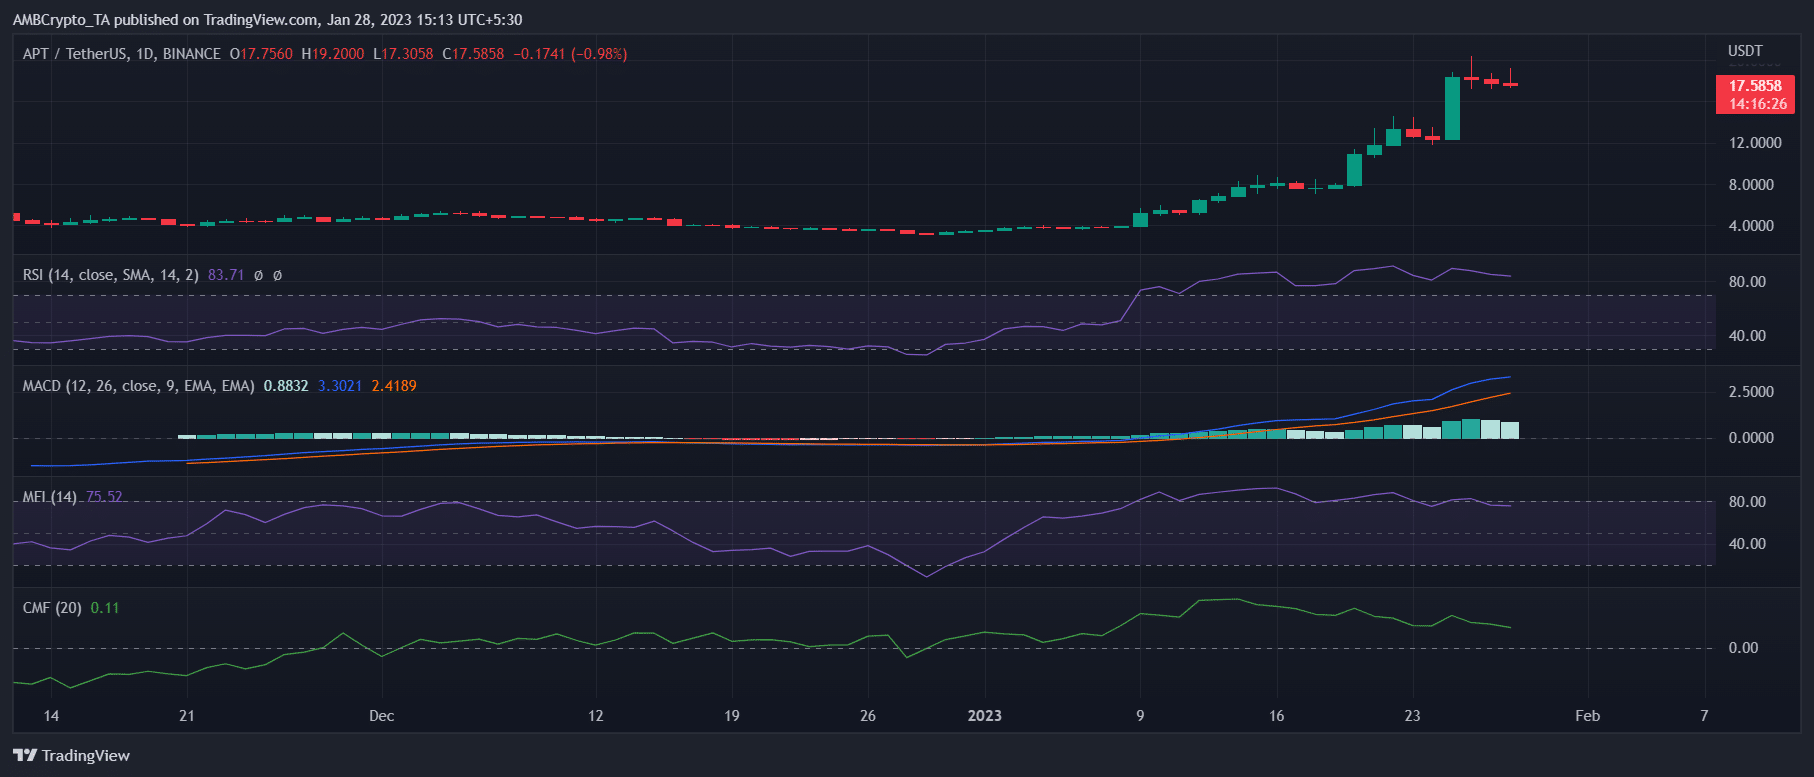
While key on-chain metrics looked bullish, APT’s daily chart revealed quite a few indicators that suggested otherwise. For instance, the Relative Strength Index (RSI) was in the overbought zone and registered a downtick.
The Money Flow Index (MFI) was also hovering near the overbought zone, which looked concerning. APT’s Chaikin Money Flow (CMF), on the other hand, declined and was heading toward the neutral mark, further suggesting that the price surge might end soon. Nonetheless, the MACD was still in the bulls’ favor.

Source: TradingView
That being said, it was pretty evident that the bull rally might continue for a little more time before the demand for APT gets arrested by the bears.

