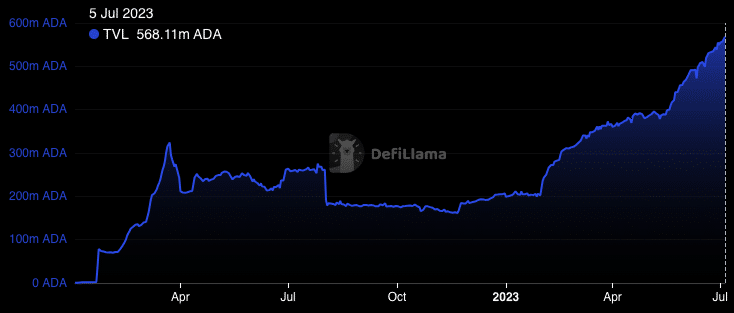
- The TVL rose to a new high amid increased activity on its underlying protocols.
- ADA’s momentum could turn bullish, but this depends on the demand created.
Thanks to the seven-day performance of the protocols and smart contracts operating under Cardano [ADA], the Total Value Locked has reached its highest point in the year. According to DefiLlama, Cardano’s TVL was $166.39 million.
Is your portfolio green? Check the Cardano Profit Calculator
Cardano’s TVL reaching a Year-To-Date (YTD) high signal growing confidence and activity on the platform. By definition, the TVL measures the amount of unique smart contract deposits into a network.

Source: DefiLlama
Thus, this milestone reflects the increasing adoption and utilization of Cardano’s decentralized Applications (dApps) including, but not limited to, lending protocols Liqwid and Optim Finance, DEXes Minswap, and SundaeSwap.
All these protocols, and others combined had notable increases that helped Cardano hit the landmark.
Fewer ADA movements; holders coping
However, the scenario with ADA circulation was a different one. According to Santiment, the seven-day circulation was down to 1.07 billion. Oftentimes, circulation shows the number of unique tokens transacted within a certain trading range.
Therefore, the decline suggested that a lot of ADA tokens have not moved since a significant hike in the metric on 25 June.
Also, the Market Value to Realized Value (MVRV) long/short difference has nosedived into the negative region. At press time, the MVRV long/short difference was -7.262%.
The idea behind the MVRV difference is to measure how much each asset holder paid for their tokens initially and compare that acquisition cost to the current price of the asset.
Usually, positive values of this metric would mean that long-term holders have realized more profits than short-term participants.
So, the drop into the negative region aligns with the earlier discussed notion that short-term holders will realize higher profits than long-term holders. And this could be attributed to ADA’s 90.53% drawdown from its All-Time High (ATH).

Source: Santiment
Red in sight amid slight chances
As per the price action, CoinMarketCap showed that ADA exchanged hands at $0.28. This was after losing 2.19% of its value in the last 24 hours.
It also seemed that the price could go below the aforementioned value. This was because the Exponential Moving Average (EMA) Slingshot had carved a bearish pattern. There were successive red candles and the second candle had a higher low than the first.
Realistic or not, here’s ADA’s market cap in BTC terms
Meanwhile, the Moving Average Convergence Divergence (MACD) showed positive signs at 0.004. When this happens, it means that there is a tendency for upward momentum. With this value, traders may want to desist from opening short positions.
In addition, the blue dynamic line rising above the orange suggests that buyers may be in tune to regain control. But this would only be the case if demand doesn’t wane.
![Cardano [ADA] price action](https://statics.ambcrypto.com/wp-content/uploads/2023/07/ADAUSD_2023-07-05_11-47-25.png)
Source: TradingView


