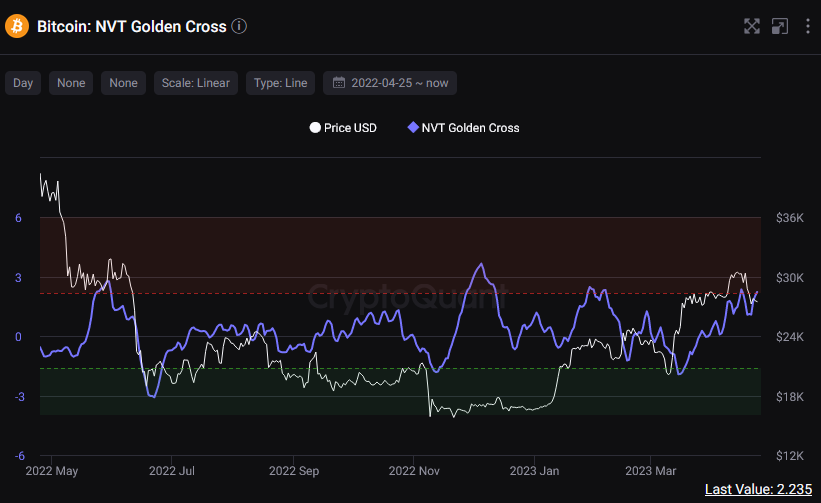
- BTC’s NVT golden cross stood above the 2.2 mark which wasn’t a good sign for the king of cryptocurrencies.
- BTC’s fear and greed index also stood in a neutral position at the time of writing.
The last 20 days have been nothing short of a rollercoaster ride, not only for Bitcoin [BTC] but also holders and investors alike. As exhilarating as BTC’s price above $30k was, its movement over the last few days could be deemed as the opposite.
How many are 1,10,100 BTCs worth today?
Traders and investors could also have to brace for some more impact. As per a CryptoQuant analysis by gigisulivan, BTC’s price could drop further in the days to come. As per the analysis, BTC’s NVT golden cross ratio hit 2.235 on 25 April.
Note that anytime the NVT cross ratio goes above 2.2, the cryptocurrency is overbought. The NVT ratio surpassing the 2.2 mark meant that BTC was overbought and that a price correction could be on the cards.

Source: CryptoQuant
It’s all about the mixed tape
At the time of writing, data from CoinMarketCap indicated that BTC was exchanging hands at $28,224 and witnessed a surge of 2.85% over the last 24 hours. However, its seven-day performance was down by ∼7%.
Upon considering BTC’s exchange netflow, it could be seen that at press time, the king coin’s outflow dominated the inflow. The exchange netflow stood at -1,110 at press time.
This meant that more traders were moving their BTC out of exchanges rather than into exchanges. Definitely a favorable factor for BTC.

Source: Glassnode
Furthermore, BTC’s Relative Strength Index (RSI) stood at the neutral value of 35, which did indicate an overlooking bearish sentiment rather than a bullish one. However, the Stochastic RSI stood in an oversold position at 17. This could be an indication that a trend reversal could follow soon.

Source: CryptoQuant
However, data from intelligence platform Santiment depicted a not-so-convincing picture of the king coin. As per the chart given below, BTC’s weighted sentiment, at press time, wasn’t at its best and stood at -0.223. Furthermore, BTC’s social dominance although witnessed ups and downs, witnessed a fall at press time.

Source: Santiment
Is patience the ‘key’ to BTC?
As per an analysis by CryptoQuant analyst, CrazzyBlockk, investors that patiently held onto their BTC gained profits. As per the findings, the number of coins moved by long-term investors saw a considerable profit than those moved by short-term traders.
Is your portfolio green? Check out the Bitcoin Profit Calculator
Furthermore, a look at the long/short ratio still didn’t seem to favor the position of short-term holders. As per data from CoinGlass, BTC’s long/short ratio on 25 April favored long-term holders over short-term holders but only by a small margin.
At the time of writing, the dominance of long-term holders stood at 50.83% whereas short-term holders stood at 49.13%.

Source: coinglass
Whether one decides to hold BTC for the long or short run, at press time, BTC’s fear and greed index painted a very neutral picture. This indicated that there was no clear bullish or bearish indication in the market.
However, this also was a very strong indication that BTC could tip its scales in favor of either one in the days to come. Investors should thus, keep an eye out for any drastic market movements.
Bitcoin Fear and Greed Index is 53 – Neutral
Current price: $28,240 pic.twitter.com/6vJAjPmn28— Bitcoin Fear and Greed Index (@BitcoinFear) April 25, 2023

