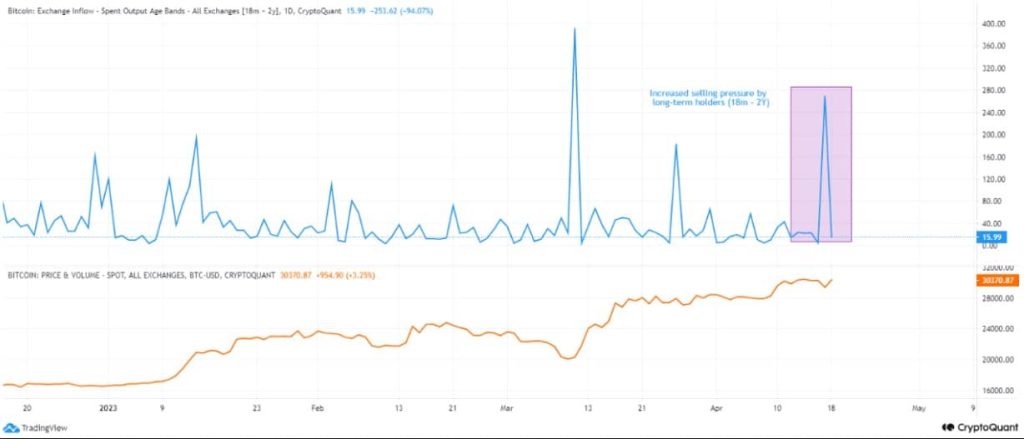
- Bitcoin sales by holders of 18 months to 2 years increased, which could have caused the latest price decline
- BTC’s social dominance increased considerably, and a few other metrics looked positive
Bitcoin [BTC] was subjected to a price correction as of 20 April, which has caused its value to once again drop under $30,000. As per CoinMarketCap, BTC’s price declined by more than 1% and 4% in the last 24 hours and the past week, respectively.
At press time, BTC was trading at $28,839.26 with a market capitalization of over $558 billion. The decline not only saddened investors, but also caused a decrease in BTC miners’ revenue, as revealed by Galssnode Alerts.
???? #Bitcoin $BTC Percent Miner Revenue from Fees (7d MA) just reached a 1-month low of 2.496%
View metric:https://t.co/NphJIZNcsL pic.twitter.com/r80W9Kxpkk
— glassnode alerts (@glassnodealerts) April 20, 2023
Is your portfolio green? Check the Bitcoin Profit Calculator
This caused the decline
CryptoOnChain, an author and analyst at CryptoQuant, recently posted an interesting analysis that pointed out the possible reason behind BTC’s latest price correction. As per the analysis, there was an increase in Bitcoin sales by holders of 18 months to 2 years, which could have caused BTC’s price to sink.

Source: CryptoQuant
However, BTC’s price correction could be short-lived. The analysis also highlighted the fact that BTC’s exchange outflow increased considerably, suggesting that Bitcoin is likely to be supported and a trend reversal can happen soon.
BTC’s social dominance is encouraging
Santiment’s recent market analysis video on YouTube revealed yet another positive signal for BTC. As per the analyst, BTC’s social dominance has increased considerably over the past few weeks. This was optimistic for BTC’s long-term performance.

Source: Santiment
However, the concerning factor was a bearish divergence, which was noted in BTC’s trading volume. BTC’s trading volume declined considerably while its price surged, which can cause trouble for BTC in the weeks to follow.

Source: Santiment
Here is what other metrics suggested…
As per CryptoQuant, Bitcoin’s exchange reserve was decreasing. BTC’s seven-day average net deposits on exchanges were also low. These metrics indicated that the coin was not under selling pressure.

Source: CryptoQuant
BTC’s taker buy-sell ratio revealed that buying sentiment was dominant in the derivatives market, which could be taken as a positive signal as it indicated higher accumulation. The King of Cryptos’ demand in the derivatives market was also decent. Its MVRV ratio, after declining sharply, showed signs of recovery by increasing slightly on 20 April.

Source: Santiment
Read Bitcoin’s [BTC] Price Prediction 2023-24
The bulls are ahead of the bears
Bitcoin’s Exponential Moving Average (EMA) Ribbon indicated a bullish upper hand in the market as the 20-day EMA was well above the 55-day EMA. Though BTC’s Relative Strength Index (RSI) declined, it was still above the neutral zone, giving hope for a trend reversal.
Nonetheless, the Chaikin Money Flow (CMF) favored the sellers. BTC’s MACD displayed a bearish crossover, which can restrict BTC’s price from going up in the short term.

Source: TradingView


