- BTC’s 1-week average market price falls below the 200-week average for the first time.
- BTC has seen increased sell-offs in the last week.
Leading coin Bitcoin [BTC] registered a new milestone as the coin’s 1-week average market price fell deep below the 200-week average for the first time, CryptoQuant analyst Binh Dang found.
According to Dang, this means that a new bull cycle for BTC remains unconfirmed as the king coin’s price needs to experience a significant break above this level to signal a new upward trend.
Is your portfolio green? Check out the Bitcoin Profit Calculator
Dang added that the current market movement offers an opportunity for those keen on coin accumulation for long-term gains. This could be a profitable strategy if BTC’s price does eventually break through the resistance level and begin a new bull cycle, Dang argued.
Furthermore, Dang said that a sideways movement might be necessary for BTC to achieve sustainable growth. As a result, BTC’s price may need to experience a period of stability and consolidation, similar to what occurred in 2015-2016, rather than a rapid upward movement like in 2019. Dang opined:
“I expect a sideways action long enough, like 2015-2016, to move towards sustainable growth rather than rushing like in 2019,”
BTC sees an increased sell-off in the last week
According to CoinMarketCap, BTC’s price has fallen by almost 5% in the last week. As the king coin failed to reclaim the $24,000 price mark many had hoped for, coin distribution for profits became the prevalent trend among investors.
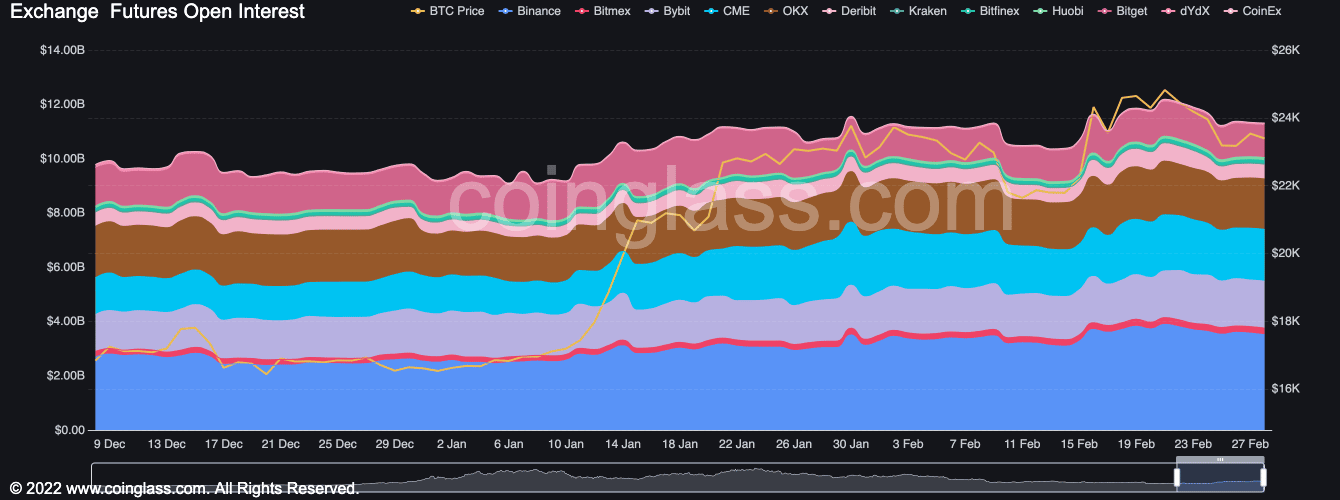
Data from Coinglass revealed a steady fall in the coin’s Open Interest in the last seven days. A decline in an asset’s Open Interest means that the number of open positions in the market has decreased, which indicates a decrease in market participation and trading activity.
It also hints at a decline in demand for the asset concerned, which is often accompanied by a price drawdown.
Since 21 February, BTC’s Open Interest has dropped by 7%.

Source: Coinglass
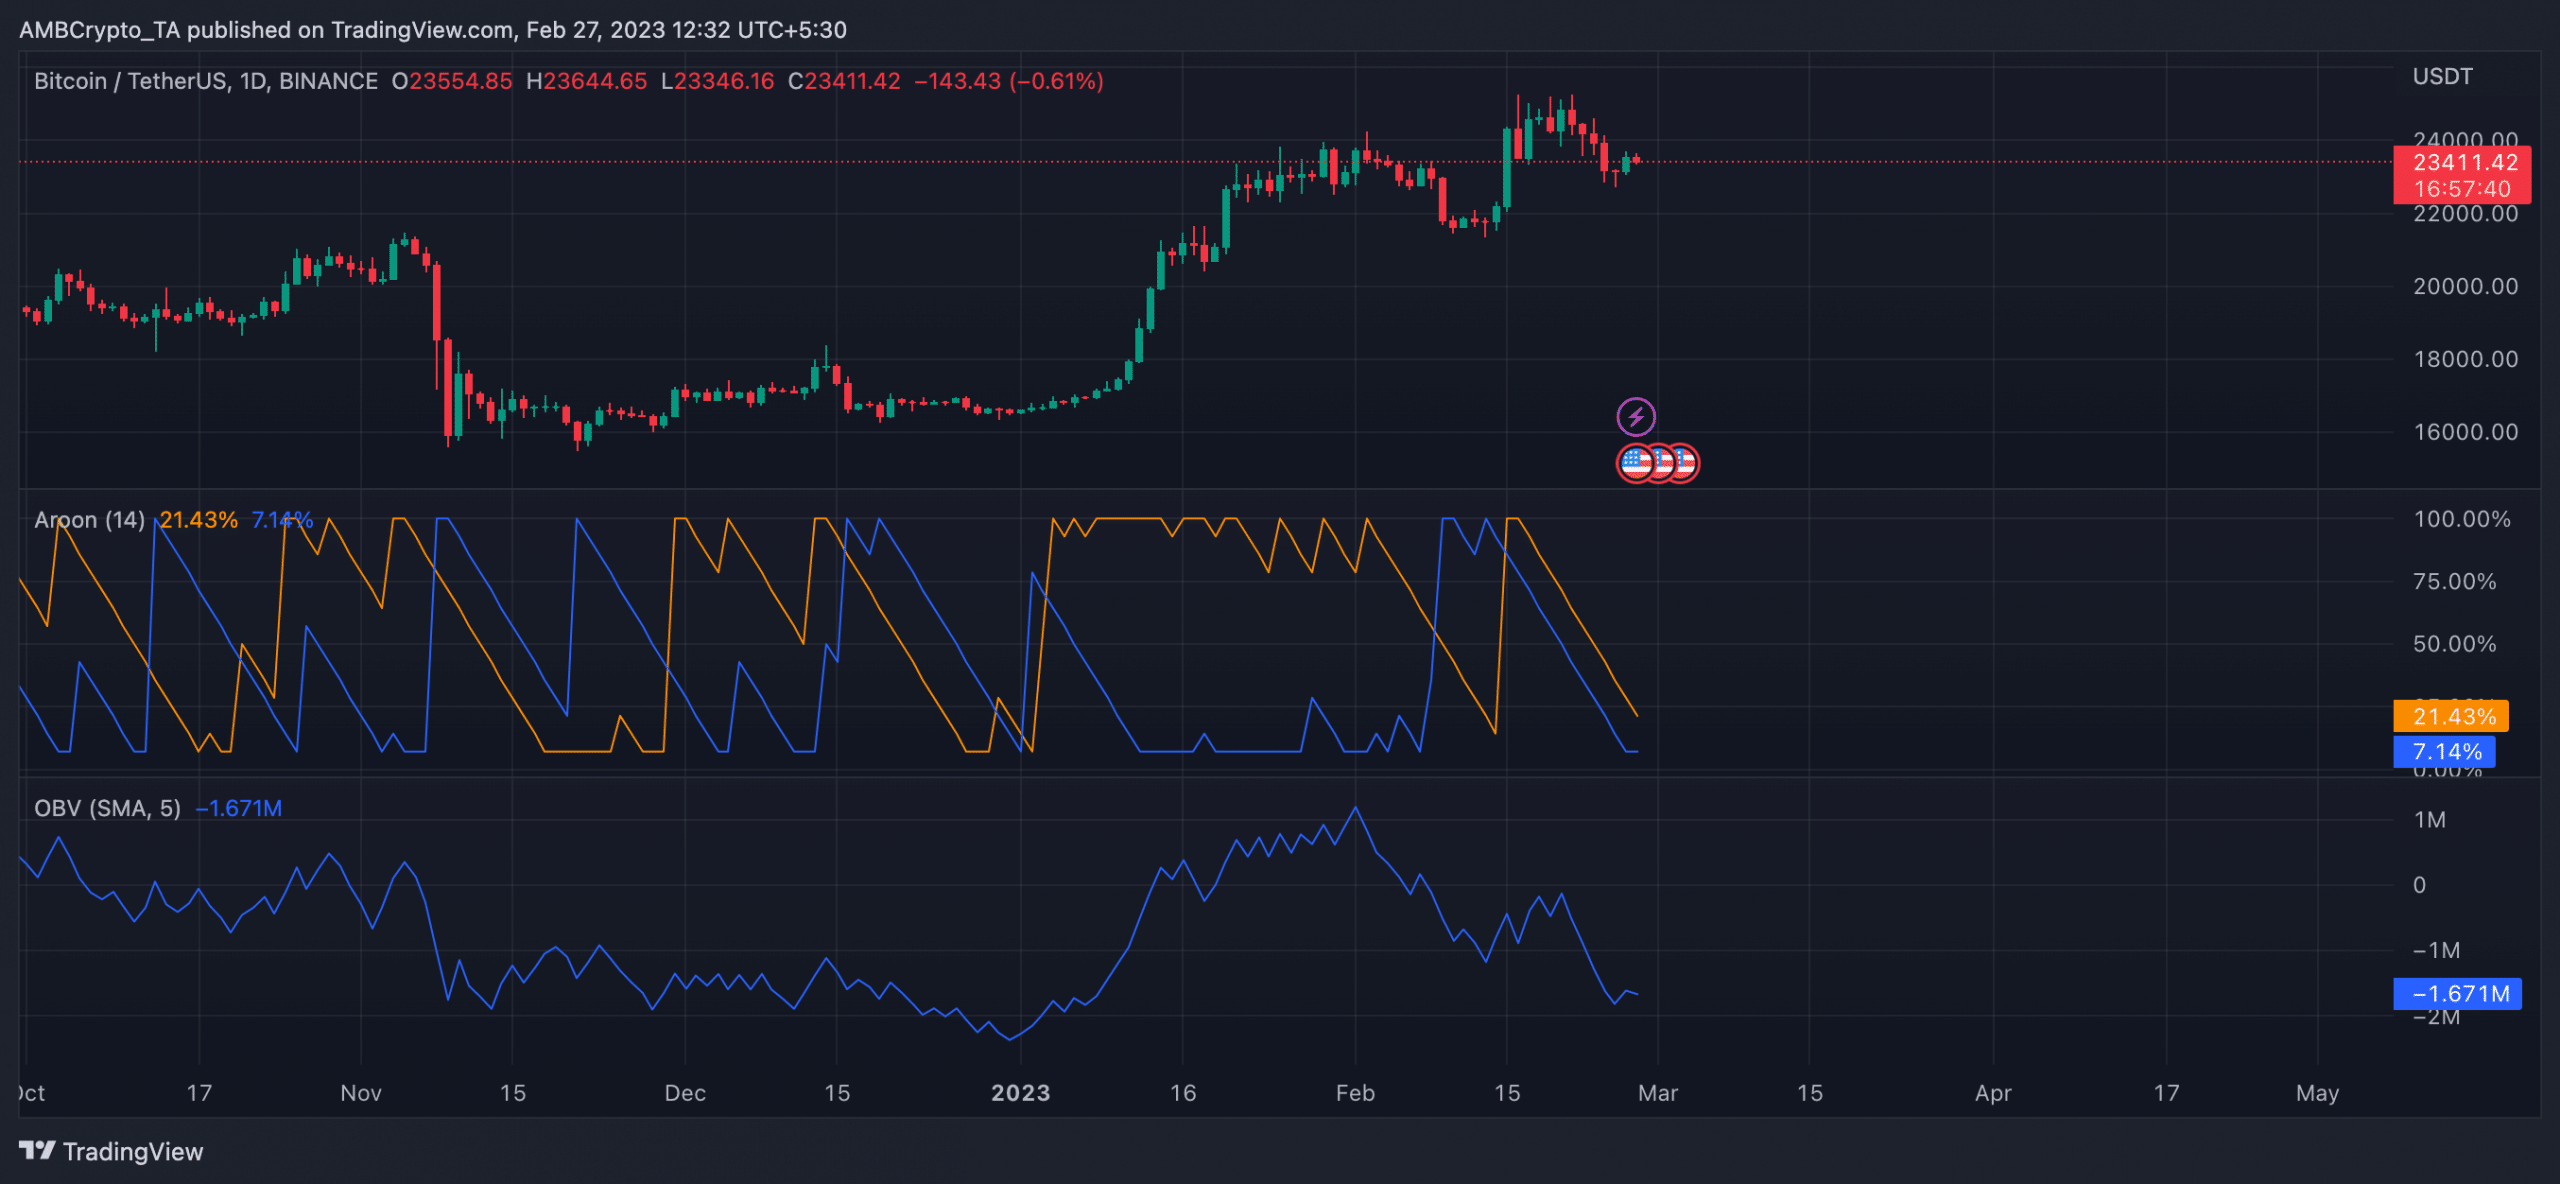
Further, since 1 February, BTC’s On-balance volume (OBV) has been on a downward trend to post a negative value by press time.
When an asset’s OBV declines into a negative value, it means that there has been more selling volume on days when the price decreased than buying volume on days when the price increased.
This is often taken as a bearish signal which indicates that there is more selling pressure than buying pressure in the market. At press time, BTC’s OBV stood at -1.671 million.
Read Bitcoin’s [BTC] Price Prediction 2023-24
Lastly, the coin’s Aroon Up Line (orange) was 21.43% as of this writing. When a coin’s Aroon Up line is close to zero, the uptrend is weak, and the most recent high was reached a long time ago. It is often followed by a continued decline in the asset’s value.

Source: BTC/USDT on TradingView

![Bitcoin [BTC]: With this new milestone, a new bull cycle remains in doubt](https://patrolcrypto.com/wp-content/uploads/2023/02/bybt_chart-17-1024x382.png)